|
|
This site
is mobile
responsive
Understanding Investment Data
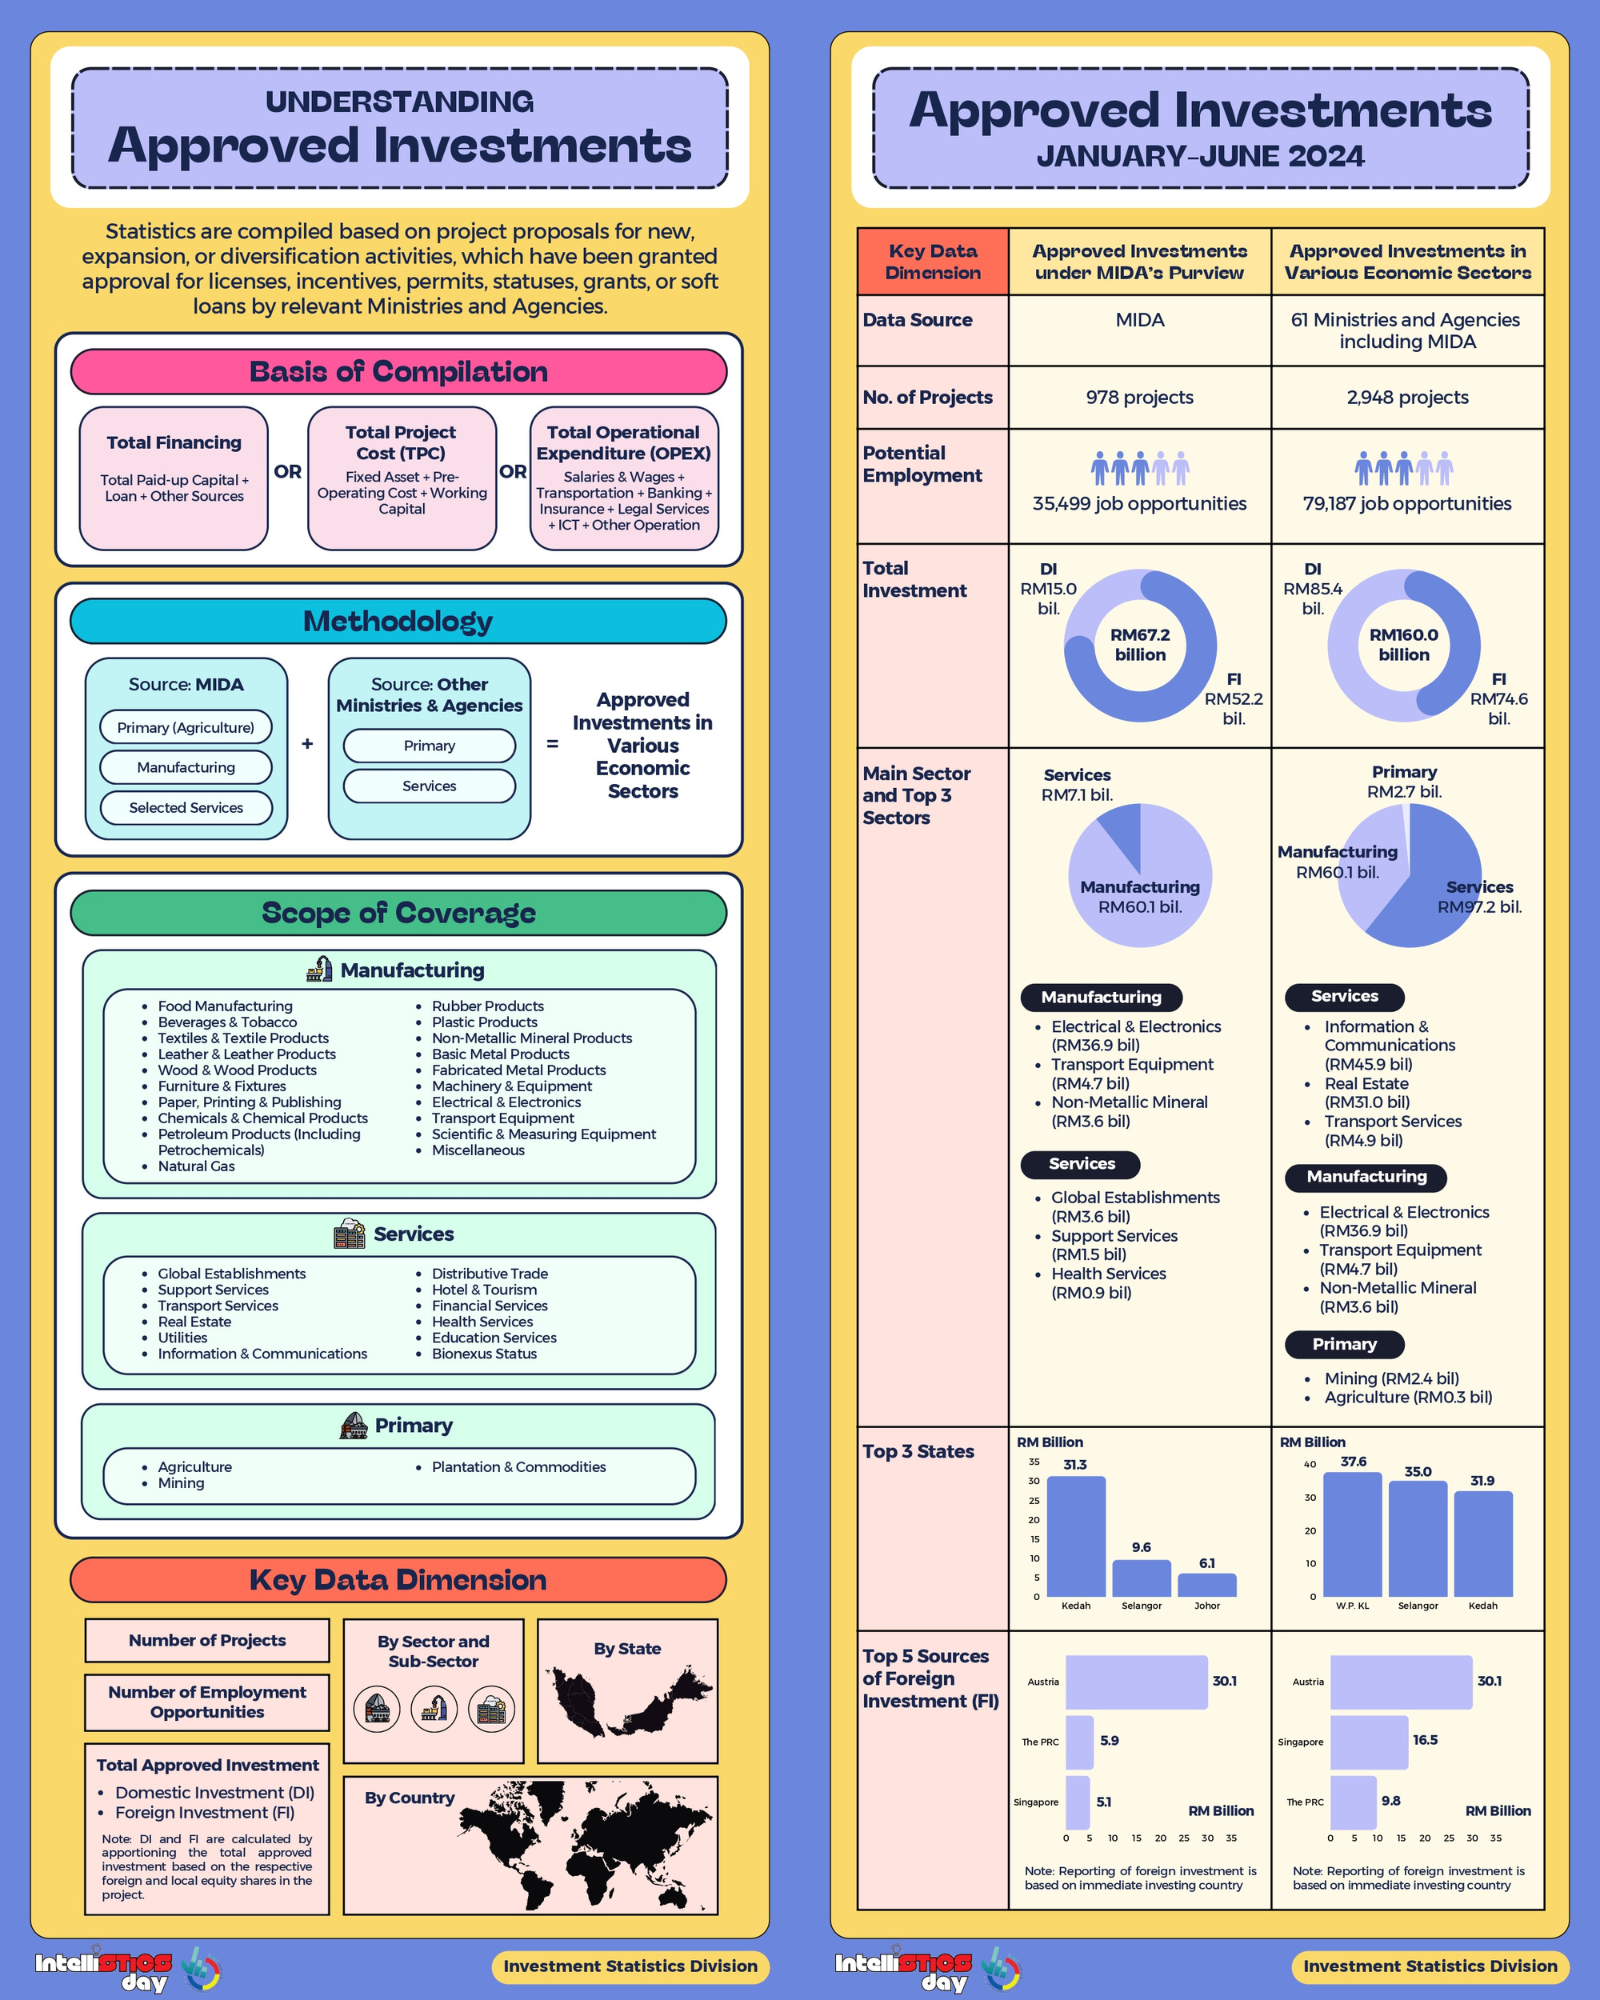
Understanding Approved Investment
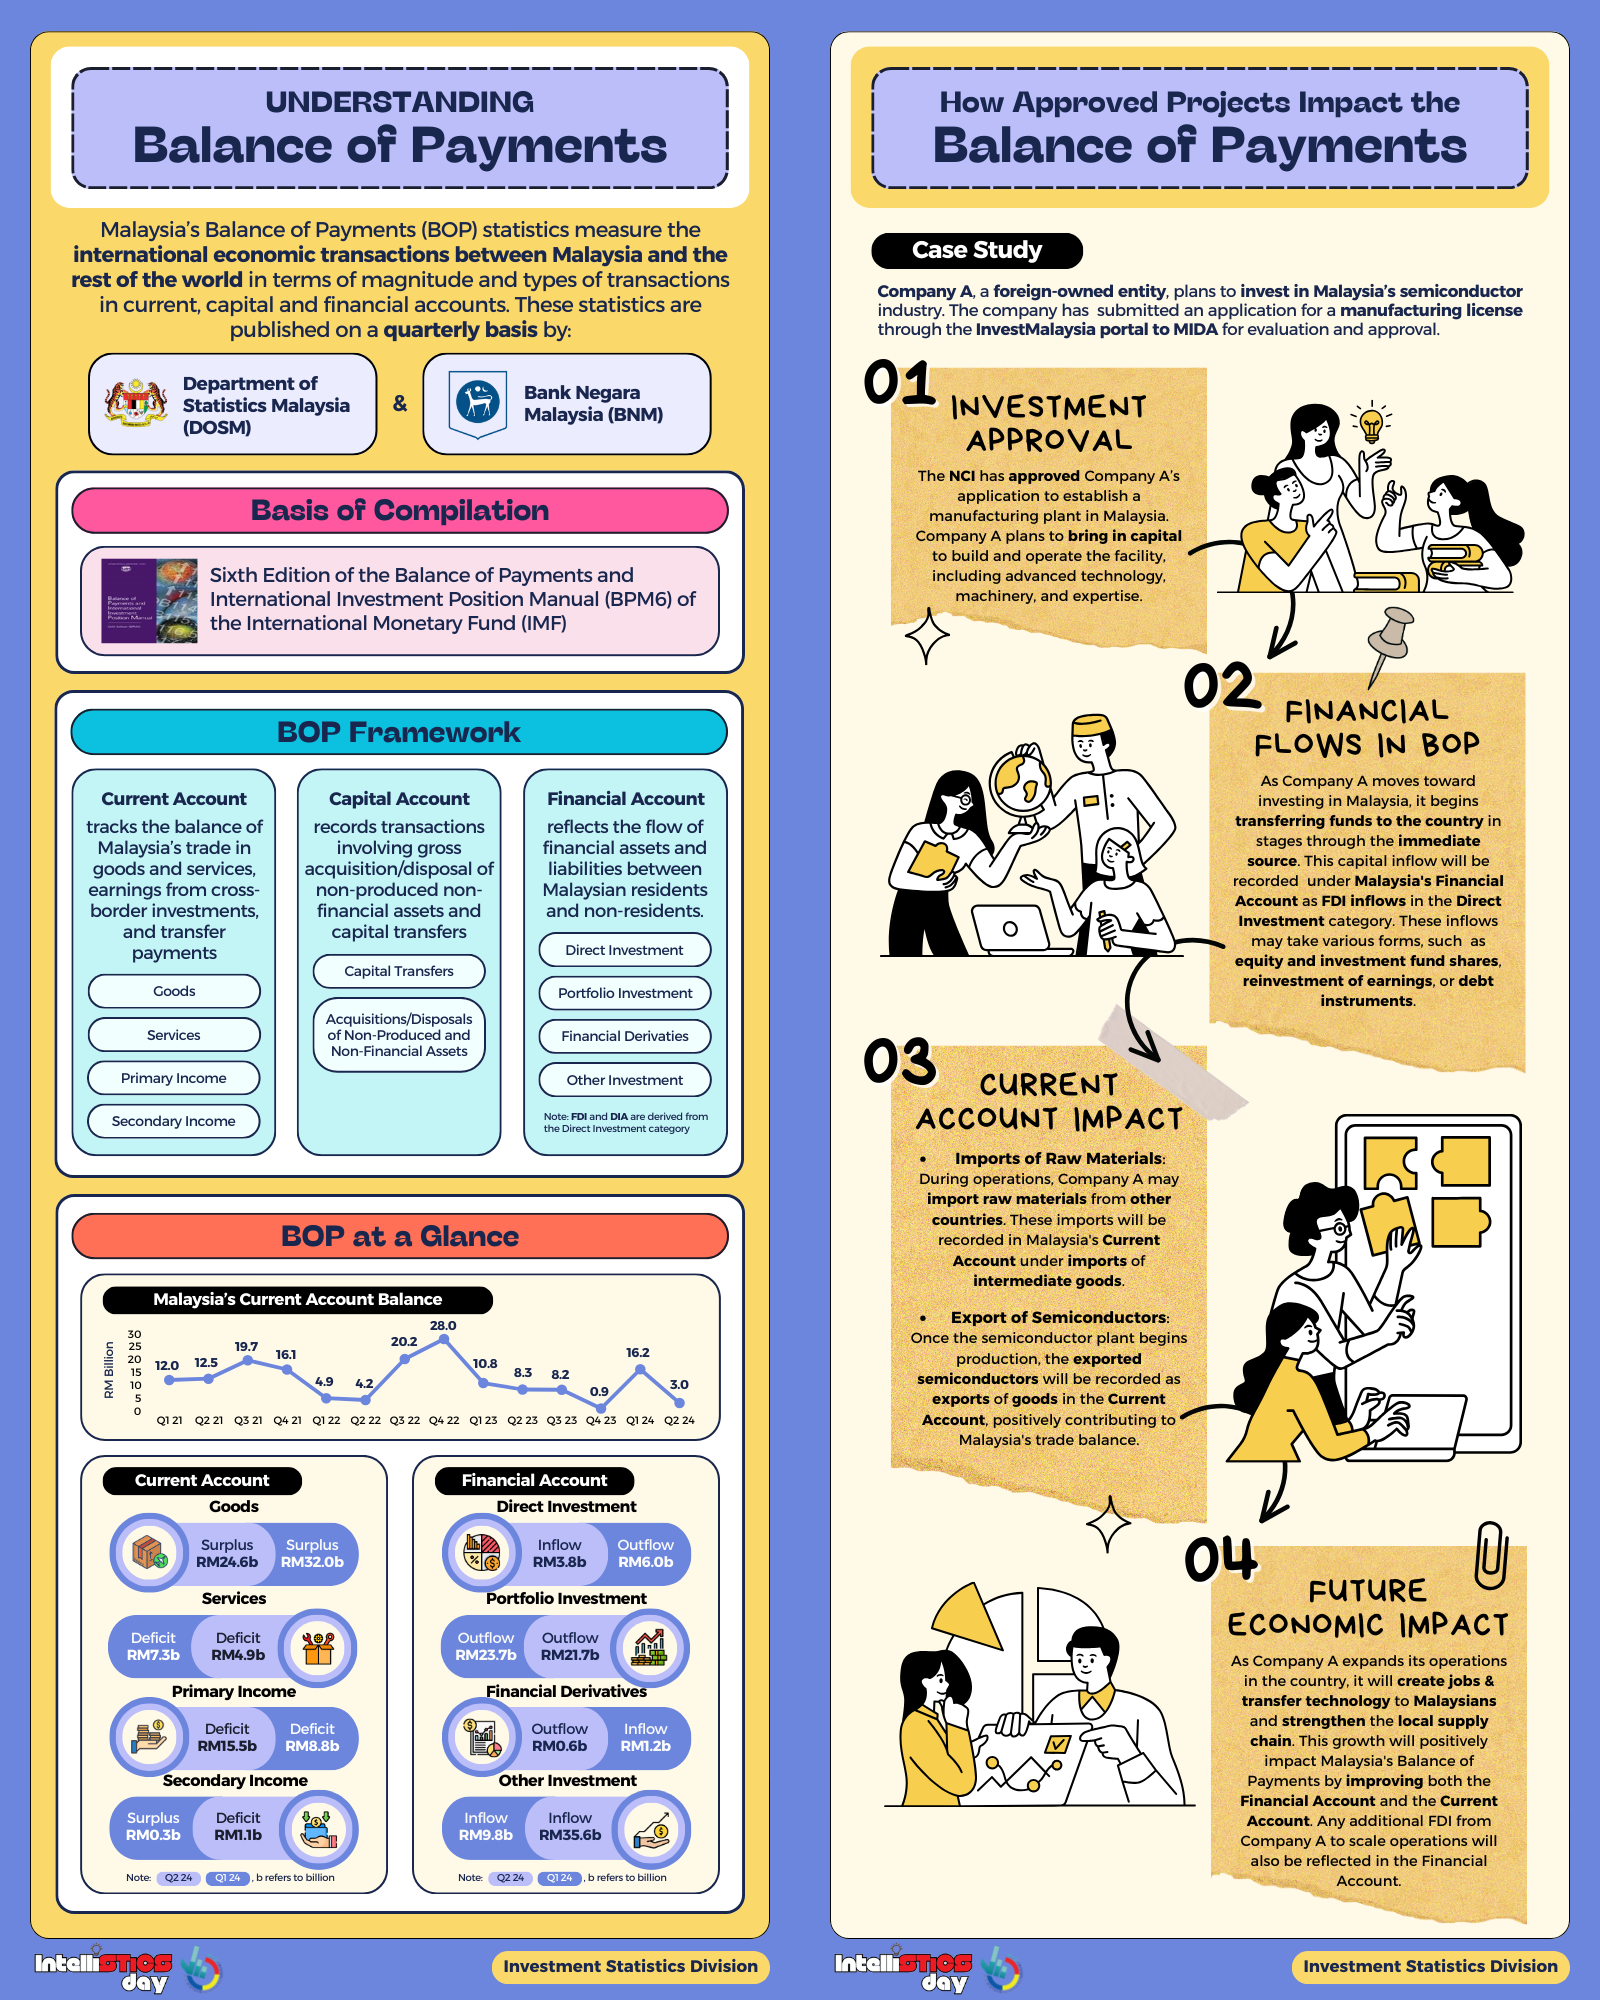
Understanding Balance of Payments
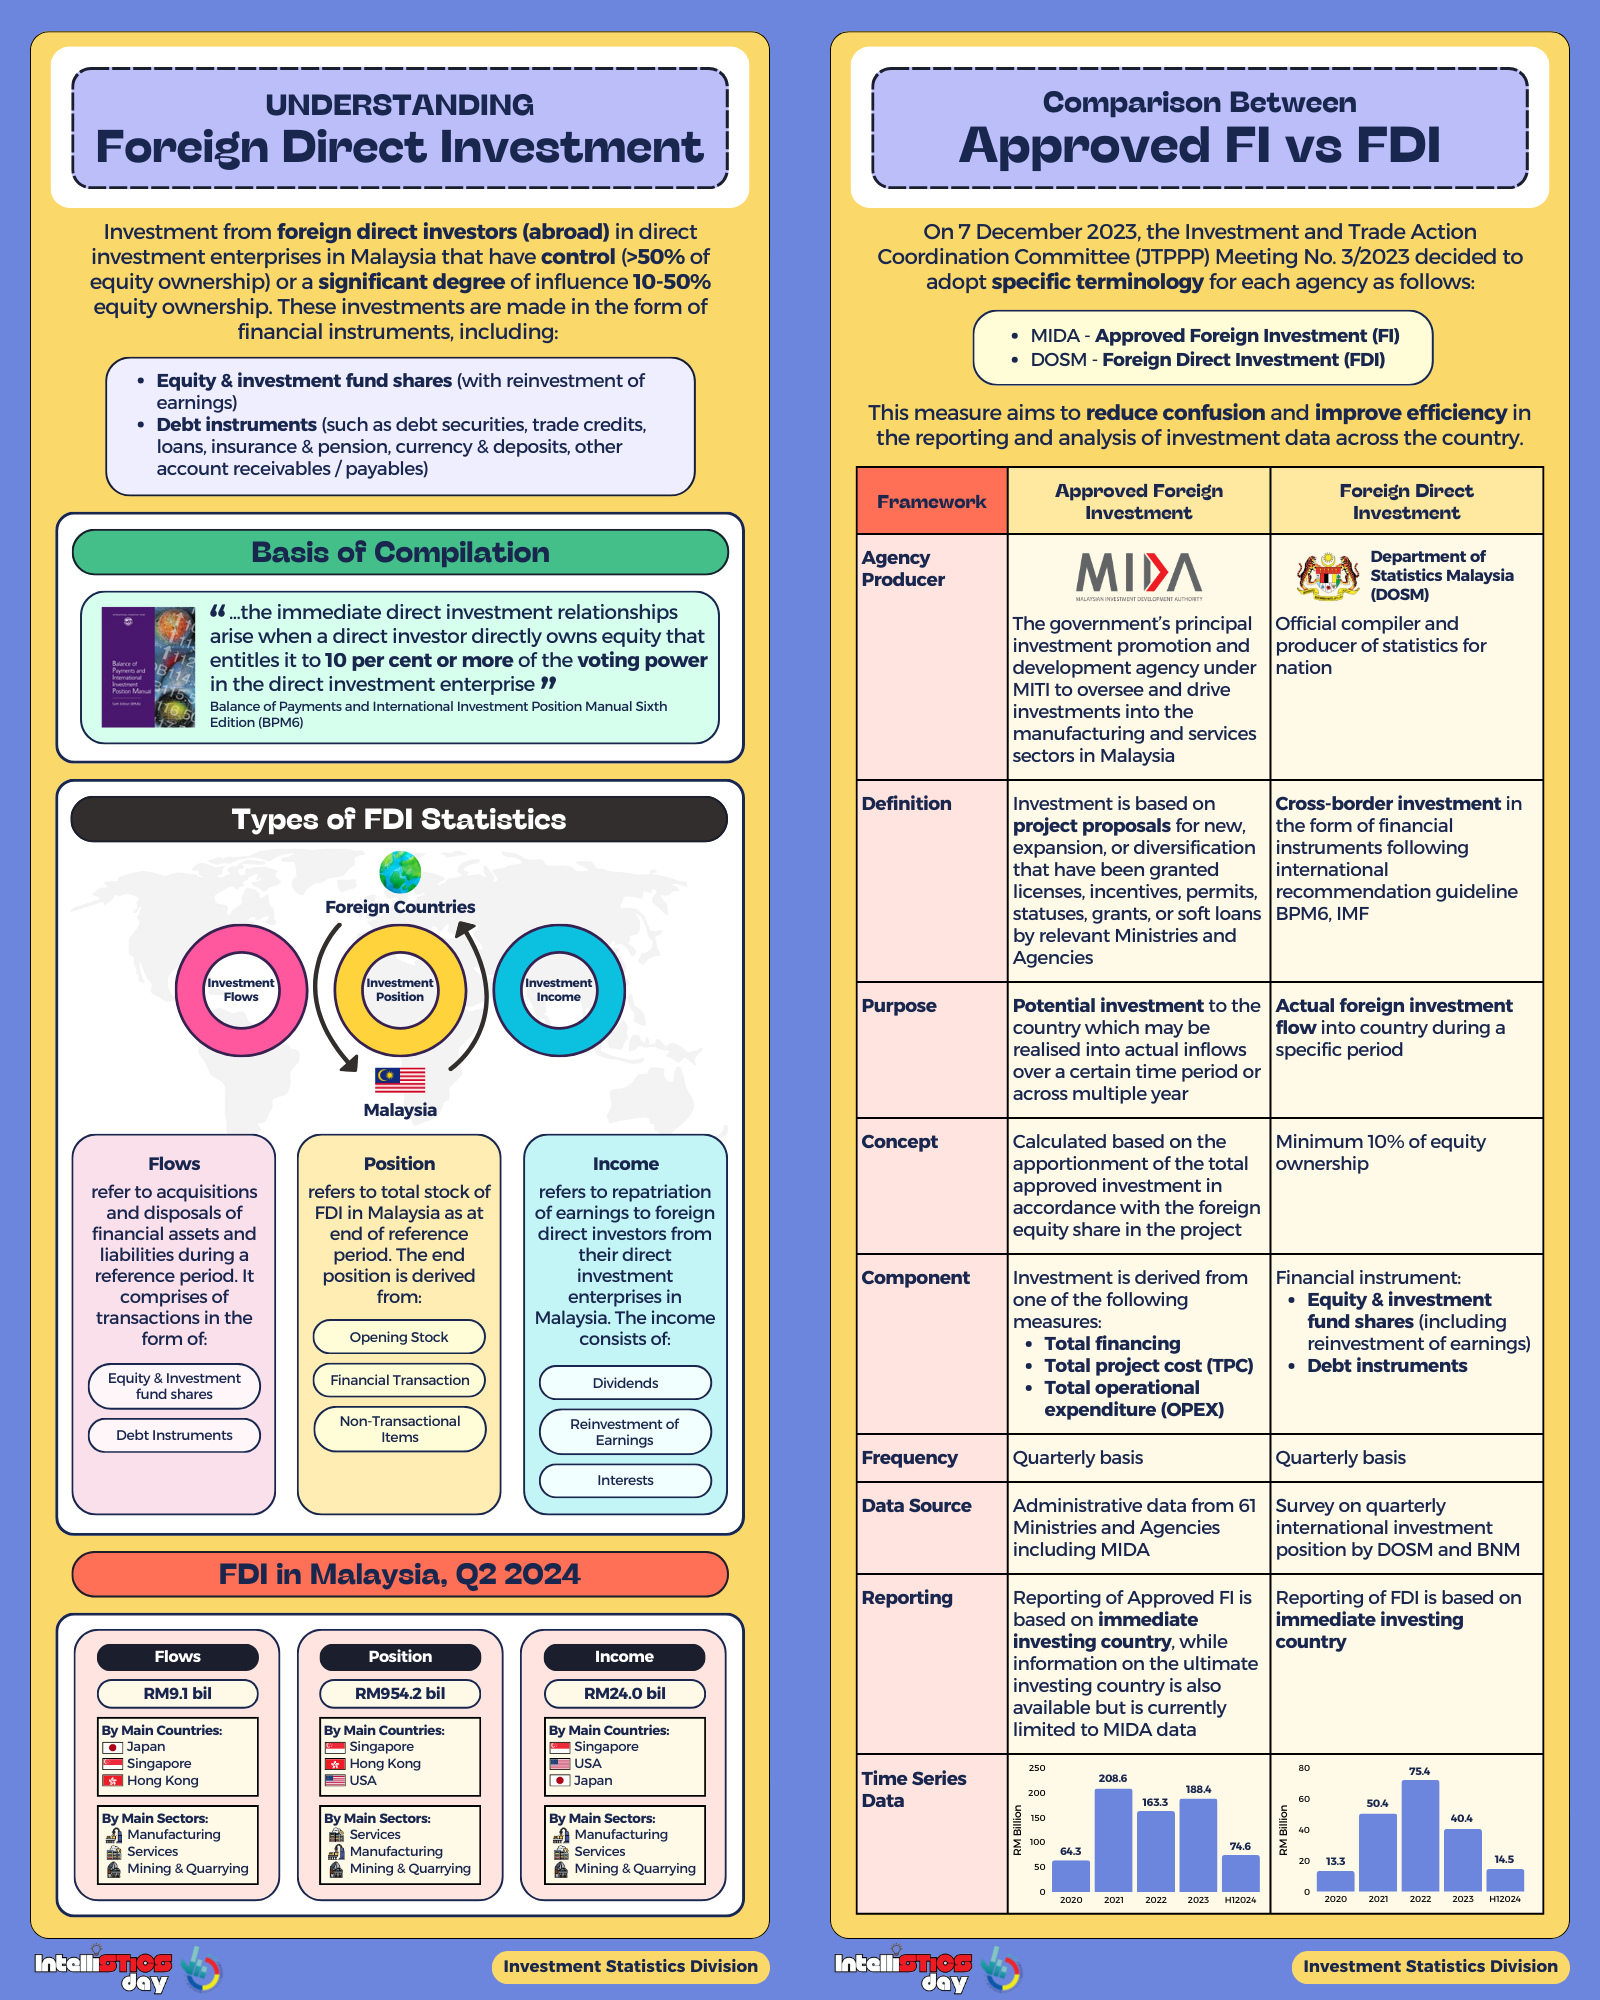
Understanding FDI vs Approved FI
Approved Investments (Overall)
Approved Private Investments in Various Economic Sectors, 2025 / 2024
| Summary | Number of Project | Potential Employment | Domestic Investment (RM million)* | Foreign Investment (RM million)* | Total Capital Investment (RM million)* |
|||||
|---|---|---|---|---|---|---|---|---|---|---|
| 2025 | 2024 (R) | 2025 | 2024 (R) | 2025 | 2024 (R) | 2025 | 2024 (R) | 2025 | 2024 (R) | |
| Primary Sector | 32 | 75 | 28 | 463 | 11,670.3 | 6,620.5 | 2,492.5 | 1,525.9 | 14,162.8 | 8,146.3 |
| Manufacturing Sector | 1,354 | 1,108 | 109,948 | 87,695 | 30,721.1 | 31,591.8 | 100,576.0 | 88,891.7 | 131,297.1 | 120,483.6 |
| Services Sector** | 7,004 | 6,499 | 134,926 | 119,560 | 177,221.5 | 174,894.1 | 104,055.5 | 80,856.1 | 281,277.0 | 255,750.2 |
| Total | 8,390 | 7,682 | 244,902 | 207,718 | 219,612.8 | 213,106.4 | 207,124.0 | 171,273.7 | 426,736.8 | 384,380.1 |
| Summary | Number of Project | Potential Employment | Domestic Investment (USD million)* | Foreign Investment (USD million)* | Total Capital Investment (USD million)* |
|||||
|---|---|---|---|---|---|---|---|---|---|---|
| 2025 | 2024 (R) | 2025 | 2024 (R) | 2025 | 2024 (R) | 2025 | 2024 (R) | 2025 | 2024 (R) | |
| Primary Sector | 32 | 75 | 28 | 463 | 2,874.4 | 1,484.4 | 613.9 | 342.1 | 3,488.4 | 1,826.5 |
| Manufacturing Sector | 1,354 | 1,108 | 109,948 | 87,695 | 7,566.8 | 7,083.4 | 24,772.4 | 19,930.9 | 32,339.2 | 27,014.3 |
| Services Sector** | 7,004 | 6,499 | 134,926 | 119,560 | 43,650.6 | 39,213.9 | 25,629.4 | 18,129.2 | 69,280.0 | 57,343.1 |
| Total | 8,390 | 7,682 | 244,902 | 207,718 | 54,091.8 | 47,781.7 | 51,015.8 | 38,402.2 | 105,107.6 | 86,183.9 |
Note :
* – Due to rounding, figures presented in this table may not add up precisely to the totals provided
** – For the services sector, selected data for the transport services, financial services, utilities and information & communications subsectors is only available up to September 2025
(R) – Revised Figures
2025 : US$1 = RM4.06
2024 : US$1 = RM4.46
Approved Private Investments By Major Foreign Investors (Ultimate Source), 2025 / 2024
| Foreign Investor*** | 2025** | 2024 (R) | ||
|---|---|---|---|---|
| Number of Project | Foreign Investment* (RM million) | Number of Project | Foreign Investment* (RM million) |
|
| Singapore | 342 | 58,345.3 | 315 | 24,906.9 |
| The People's Republic of China | 351 | 57,981.0 | 190 | 28,441.0 |
| United States of America (USA) | 84 | 15,124.1 | 69 | 33,515.7 |
| Foreign Investor*** | 2025** | 2024 (R) | ||
|---|---|---|---|---|
| Number of Project | Foreign Investment* (USD million) | Number of Project | Foreign Investment* (USD million) |
|
| Singapore | 342 | 14,370.8 | 315 | 5,584.5 |
| The People's Republic of China | 351 | 14,281.0 | 190 | 6,376.9 |
| United States of America (USA) | 84 | 3,725.1 | 69 | 7,514.7 |
Note :
* – Due to rounding, figures presented in this table may not add up precisely to the totals provided
** – Selected data for the transport services, financial services, utilities and information & communications subsectors is only available up to September 2025
*** – Reporting of foreign investment is based on the ultimate source
(R) – Revised Figures
2025 : US$1 = RM4.06
2024 : US$1 = RM4.46
Approved Private Investments by Major Foreign Investors (Immediate Source), 2025 / 2024
| Foreign Investor*** | 2025** | 2024 (R) | ||
|---|---|---|---|---|
| Number of Project | Foreign Investment* (RM million) | Number of Project | Foreign Investment* (RM million) |
|
| Singapore | 540 | 93,178.1 | 496 | 42,174.4 |
| The People's Republic of China | 328 | 41,889.1 | 187 | 14,200.0 |
| The Netherlands | 31 | 13,845.8 | 35 | 4,970.4 |
| Foreign Investor*** | 2025** | 2024 (R) | ||
|---|---|---|---|---|
| Number of Project | Foreign Investment* (USD million) | Number of Project | Foreign Investment* (USD million) |
|
| Singapore | 540 | 22,950.3 | 496 | 9,456.2 |
| The People's Republic of China | 328 | 10,317.5 | 187 | 3,183.9 |
| The Netherlands | 31 | 3,410.3 | 35 | 1,114.4 |
Note :
* – Due to rounding, figures presented in this table may not add up precisely to the totals provided
** – Selected data for the transport services, financial services, utilities and information & communications subsectors is only available up to September 2025
*** – Reporting of foreign investment is based on the immediate source
(R) – Revised Figures
2025 : US$1 = RM4.06
2024 : US$1 = RM4.46
Approved Private Investments by State, 2025 / 2024
| State | 2025** | 2024 (R) | ||||
|---|---|---|---|---|---|---|
| Domestic Investment (RM million)* | Foreign Investment (RM million)* | Total Capital Investment (RM million)* | Domestic Investment (RM million)* | Foreign Investment (RM million)* | Total Capital Investment (RM million)* |
|
| Johor | 49,512.2 | 60,518.9 | 110,031.1 | 18,814.5 | 29,031.5 | 47,846.1 |
| Selangor | 48,852.7 | 35,063.7 | 83,916.4 | 75,898.9 | 25,891.7 | 101,790.6 |
| Wilayah Persekutuan Kuala Lumpur | 39,883.5 | 23,379.2 | 63,262.7 | 49,754.7 | 39,454.9 | 89,209.6 |
| State | 2025** | 2024 (R) | ||||
|---|---|---|---|---|---|---|
| Domestic Investment (USD million)* | Foreign Investment (USD million)* | Total Capital Investment (USD million)* | Domestic Investment (USD million)* | Foreign Investment (USD million)* | Total Capital Investment (USD million)* |
|
| Johor | 12,195.1 | 14,906.1 | 27,101.3 | 4,218.5 | 6,509.3 | 10,727.8 |
| Selangor | 12,032.7 | 8,636.4 | 20,669.1 | 17,017.7 | 5,805.3 | 22,823.0 |
| Wilayah Persekutuan Kuala Lumpur | 9,823.5 | 5,758.4 | 15,581.9 | 11,155.8 | 8,846.4 | 20,002.2 |
Note :
* – Due to rounding, figures presented in this table may not add up precisely to the totals provided
** – Selected data for the transport services, financial services, utilities and information & communications subsectors is only available up to September 2025
*** – Proposed state details not available
2025 : US$1 = RM4.06
2024 : US$1 = RM4.46
Approved Investments (Manufacturing Sector)
Overview: Projects Approved, 2025 / 2024
| 2025 | 2024 (R) | |||||
|---|---|---|---|---|---|---|
| New | Expansion/ Diversification | Total | New | Expansion/ Diversification | Total | |
| Number | 796 | 558 | 1,354 | 691 | 417 | 1,108 |
| Potential Employment | 66,232 | 43,716 | 109,948 | 50,502 | 37,193 | 87,695 |
| Total Capital Invesment* (RM million) | 86,378.1 | 44,919.0 | 131,297.1 | 49,768.8 | 70,714.8 | 120,483.6 |
| – Domestic invesment* | 16,585.2 | 14,135.9 | 30,721.1 | 17,192.5 | 14,399.3 | 31,591.8 |
| – Foreign Investment* | 69,792.9 | 30,783.1 | 100,576.0 | 32,576.3 | 56,315.5 | 88,891.7 |
| 2025 | 2024 (R) | |||||
|---|---|---|---|---|---|---|
| New | Expansion/ Diversification | Total | New | Expansion/ Diversification | Total | |
| Number | 796 | 558 | 1,354 | 691 | 417 | 1,108 |
| Potential Employment | 66,232 | 43,716 | 109,948 | 50,502 | 37,193 | 87,695 |
| Total Capital Invesment* (USD million) | 21,275.4 | 11,063.8 | 32,339.2 | 11,158.9 | 15,855.3 | 27,014.3 |
| – Domestic invesment* | 4,085.0 | 3,481.7 | 7,566.8 | 3,854.8 | 3,228.6 | 7,083.4 |
| – Foreign Investment* | 17,190.4 | 7,582.0 | 24,772.4 | 7,304.1 | 12,626.8 | 19,930.9 |
Note :
* – Due to rounding, figures presented in this table may not add up precisely to the totals provided
(R) – Revised Figures
2025 : US$1 = RM4.06
2024 : US$1 = RM4.46
Manufacturing Projects Approved By Major Foreign Investors – Ultimate Source, 2025 / 2024
| Foreign Investor | 2025** | 2024 (R)** | ||
|---|---|---|---|---|
| Number of Project | Foreign Investment* (RM million) | Number of Project | Foreign Investment* (RM million) |
|
| The People's Republic of China | 226 | 43,727.70 | 122 | 22,983.40 |
| Singapore | 97 | 8,925.20 | 95 | 5,838.90 |
| United States of America (USA) | 46 | 7,190.90 | 28 | 7,245.10 |
| Foreign Investor | 2025** | 2024 (R)** | ||
|---|---|---|---|---|
| Number of Project | Foreign Investment* (USD million) | Number of Project | Foreign Investment* (USD million) |
|
| The People's Republic of China | 226 | 10,770.4 | 122 | 5,153.2 |
| Singapore | 97 | 2,198.3 | 95 | 1,309.2 |
| United States of America (USA) | 46 | 1,771.2 | 28 | 1,624.5 |
Note:
* – Due to rounding, figures presented in this table may not add up precisely to the totals provided
** – Reporting of foreign investment is based on the ultimate source
(R) – Revised Figures
2025 : US$1 = RM4.06
2024 : US$1 = RM4.46
Manufacturing Projects Approved By Major Foreign Investors – Immediate Source, 2025 / 2024
| Foreign Investor | 2025** | 2024 (R)** | ||
|---|---|---|---|---|
| Number of Project | Foreign Investment* (RM million) | Number of Project | Foreign Investment* (RM million) |
|
| Singapore | 219 | 29,583.6 | 178 | 15,069.8 |
| The People's Republic of China | 193 | 27,610.3 | 107 | 9,762.7 |
| Hong Kong SAR | 79 | 12,440.1 | 33 | 12,750.9 |
| Foreign Investor | 2025** | 2024 (R)** | ||
|---|---|---|---|---|
| Number of Project | Foreign Investment* (USD million) | Number of Project | Foreign Investment* (USD million) |
|
| Singapore | 219 | 7,286.6 | 178 | 3,378.9 |
| The People's Republic of China | 193 | 6,800.6 | 107 | 2,189.0 |
| Hong Kong SAR | 79 | 3,064.1 | 33 | 2,858.9 |
Note :
* – Due to rounding, figures presented in this table may not add up precisely to the totals provided
** – Reporting of foreign investment is based on the immediate source
(R) – Revised Figures
2025 : US$1 = RM4.06
2024 : US$1 = RM4.46
Manufacturing Projects Approved by State, 2025 / 2024
| State | 2025 | 2024 (R) | ||||
|---|---|---|---|---|---|---|
| Domestic Investment* (RM million) | Foreign Investment* (RM million) | Total Capital Investment* (RM million) | Domestic Investment* (RM million) | Foreign Investment* (RM million) | Total Capital Investment* (RM million) |
|
| Kedah | 1,787.20 | 22,832.20 | 24,619.40 | 1,421.40 | 42,629.10 | 44,050.50 |
| Johor | 5,850.20 | 18,726.90 | 24,577.10 | 5,046.30 | 8,510.10 | 13,556.40 |
| Pulau Pinang | 7,210.80 | 15,164.60 | 22,375.40 | 3,529.00 | 13,784.00 | 17,313.00 |
| State | 2025 | 2024 (R) | ||||
|---|---|---|---|---|---|---|
| Domestic Investment* (USD million) | Foreign Investment* (USD million) | Total Capital Investment* (USD million) | Domestic Investment* (USD million) | Foreign Investment* (USD million) | Total Capital Investment* (USD million) |
|
| Kedah | 440.2 | 5,623.70 | 6,063.90 | 318.7 | 9,558.10 | 9,876.80 |
| Johor | 1,440.90 | 4,612.50 | 6,053.50 | 1,131.50 | 1,908.10 | 3,039.50 |
| Pulau Pinang | 1,776.10 | 3,735.10 | 5,511.20 | 791.3 | 3,090.60 | 3,881.80 |
Note :
* – Due to rounding, figures presented in this table may not add up precisely to the totals provided
(R) – Revised Figures
2025 : US$1 = RM4.06
2024 : US$1 = RM4.46
Manufacturing Projects Approved by Industry, 2025 / 2024
| Industry | 2025 | 2024 (R) | ||||
|---|---|---|---|---|---|---|
| Domestic Investment* (RM million) | Foreign Investment* (RM million) | Total Capital Investment* (RM million) | Domestic Investment* (RM million) | Foreign Investment* (RM million) | Total Capital Investment* (RM million) |
|
| Electrical & Electronics | 4,720.3 | 23,737.9 | 28,458.2 | 2,497.1 | 53,309.5 | 55,806.5 |
| Chemicals & Chemical Products | 5,775.4 | 19,075.4 | 24,850.8 | 4,207.6 | 6,417.5 | 10,625.1 |
| Transport Equipment | 3,337.2 | 11,598.2 | 14,935.4 | 3,560.1 | 12,265.2 | 15,825.3 |
| Basic Metal Products | 491.8 | 10,610.2 | 11,102.0 | 1,180.0 | 384.8 | 1,564.8 |
| Machinery & Equipment | 2,556.9 | 8,427.9 | 10,984.8 | 4,472.8 | 6,103.8 | 10,576.6 |
| Industry | 2025 | 2024 (R) | ||||
|---|---|---|---|---|---|---|
| Domestic Investment* (USD million) | Foreign Investment* (USD million) | Total Capital Investment* (USD million) | Domestic Investment* (USD million) | Foreign Investment* (USD million) | Total Capital Investment* (USD million) |
|
| Electrical & Electronics | 1,162.6 | 5,846.8 | 7,009.4 | 559.9 | 11,952.8 | 12,512.7 |
| Chemicals & Chemical Products | 1,422.5 | 4,698.4 | 6,120.9 | 943.4 | 1,438.9 | 2,382.3 |
| Transport Equipment | 822.0 | 2,856.7 | 3,678.7 | 798.2 | 2,750.0 | 3,548.3 |
| Basic Metal Products | 121.1 | 2,613.4 | 2,734.5 | 264.6 | 86.3 | 350.8 |
| Machinery & Equipment | 629.8 | 2,075.8 | 2,705.6 | 1,002.9 | 1,368.6 | 2,371.4 |
Note :
* – Due to rounding, figures presented in this table may not add up precisely to the totals provided
(R) – Revised Figures
2025 : US$1 = RM4.06
2024 : US$1 = RM4.46
Approved Investments (Services Sector)
Approved Private Investments In Services Sector, 2025 / 2024
| Services Sector | Number of Project | Potential Employment | Domestic Investment (RM million)* | Foreign Investment (RM million)* | Total Investment (RM million)* |
|||||
|---|---|---|---|---|---|---|---|---|---|---|
| 2025 | 2024 (R) | 2025 | 2024 (R) | 2025 | 2024 (R) | 2025 | 2024 (R) | 2025 | 2024 (R) | |
| Information & Communications** | 761 | 2,404 | 32,028 | 48,576 | 62,406.8 | 75,043.5 | 90,512.9 | 60,967.7 | 152,919.7 | 136,011.2 |
| Real Estate | 1,123 | 1,349 | 14 | 0 | 78,250.0 | 64,549.4 | 0.0 | 0.0 | 78,250.0 | 64,549.4 |
| Utilities** | 32 | 25 | 0 | 0 | 13,731.8 | 11,067.9 | 0.0 | 0.0 | 13,731.8 | 11,067.9 |
| Support Services | 3,219 | 979 | 8,144 | 1,567 | 10,275.8 | 11,966.3 | 2,369.8 | 896.1 | 12,645.6 | 12,862.3 |
| Distributive Trade | 1,510 | 1,411 | 86,998 | 54,678 | 830.8 | 1,461.2 | 10,004.6 | 6,642.6 | 10,835.4 | 8,103.9 |
| Financial Services** | 46 | 46 | 340 | 215 | 5,857.6 | 3,330.4 | 572.6 | 1,040.4 | 6,430.2 | 4,370.7 |
| Hotel & Tourism | 32 | 17 | 2,498 | 1,072 | 2,184.2 | 814.0 | 43.4 | 654.9 | 2,227.6 | 1,468.9 |
| Transport Services** | 53 | 83 | 950 | 11,186 | 1,842.1 | 4,830.8 | 218.3 | 6,591.8 | 2,060.4 | 11,422.6 |
| Health Services | 4 | 2 | 2,213 | 1,192 | 721.9 | 1,219.7 | 148.9 | 0.0 | 870.8 | 1,219.7 |
| Education Services | 119 | 96 | 954 | 640 | 689.0 | 594.0 | 18.1 | 19.5 | 707.1 | 613.5 |
| Global Establishment | 70 | 84 | 787 | 434 | 0.0 | 0.0 | 145.1 | 4,043.2 | 145.1 | 4,043.2 |
| Other Services | 35 | 3 | 0 | 0 | 431.5 | 16.9 | 21.7 | 0.0 | 453.2 | 16.9 |
| Total | 7,004 | 6,499 | 134,926 | 119,560 | 177,221.5 | 174,894.1 | 104,055.5 | 80,856.1 | 281,277.0 | 255,750.2 |
| Services Sector | Number of Project | Potential Employment | Domestic Investment (USD million)* | Foreign Investment (USD million)* | Total Investment (USD million)* |
|||||
|---|---|---|---|---|---|---|---|---|---|---|
| 2025 | 2024 (R) | 2025 | 2024 (R) | 2025 | 2024 (R) | 2025 | 2024 (R) | 2025 | 2024 (R) | |
| Information & Communications** | 761 | 2,404 | 32,028 | 48,576 | 15,371.1 | 16,825.9 | 22,293.8 | 13,669.9 | 37,665.0 | 30,495.8 |
| Real Estate | 1,123 | 1,349 | 14 | 0 | 19,273.4 | 14,473.0 | 0.0 | 0.0 | 19,273.4 | 14,473.0 |
| Utilities** | 32 | 25 | 0 | 0 | 3,382.2 | 2,481.6 | 0.0 | 0.0 | 3,382.2 | 2,481.6 |
| Support Services | 3,219 | 979 | 8,144 | 1,567 | 2,531.0 | 2,683.0 | 583.7 | 200.9 | 3,114.7 | 2,883.9 |
| Distributive Trade | 1,510 | 1,411 | 86,998 | 54,678 | 204.6 | 327.6 | 2,464.2 | 1,489.4 | 2,668.8 | 1,817.0 |
| Financial Services** | 46 | 46 | 340 | 215 | 1,442.8 | 746.7 | 141.0 | 233.3 | 1,583.8 | 980.0 |
| Hotel & Tourism | 32 | 17 | 2,498 | 1,072 | 538.0 | 182.5 | 10.7 | 146.8 | 548.7 | 329.4 |
| Transport Services** | 53 | 83 | 950 | 11,186 | 453.7 | 1,083.1 | 53.8 | 1,478.0 | 507.5 | 2,561.1 |
| Health Services | 4 | 2 | 2,213 | 1,192 | 177.8 | 273.5 | 36.7 | 0.0 | 214.5 | 273.5 |
| Education Services | 119 | 96 | 954 | 640 | 169.7 | 133.2 | 4.5 | 4.4 | 174.2 | 137.5 |
| Global Establishment | 70 | 84 | 787 | 434 | 0.0 | 0.0 | 35.7 | 906.6 | 35.7 | 906.6 |
| Other Services | 35 | 3 | 0 | 0 | 106.3 | 3.8 | 5.4 | 0.0 | 111.6 | 3.8 |
| Total | 7,004 | 6,499 | 134,926 | 119,560 | 43,650.6 | 39,213.9 | 25,629.4 | 18,129.2 | 69,280.0 | 57,343.1 |
Note :
* – Due to rounding, figures presented in this table may not add up precisely to the totals provided
** : Selected data for the transport services, financial services, utilities, and information & communications subsectors is only available up to September 2025
(R) – Revised Figures
2025 : US$1 = RM4.06
2024 : US$1 = RM4.46
Approved Investments (Primary Sector)
Approved Private Investments In Primary Sector, 2025 / 2024
| Primary Sector | Number of Project | Potential Employment | Domestic Investment (RM million)* | Foreign Investment (RM million)* | Total Investment (RM million)* |
|||||
|---|---|---|---|---|---|---|---|---|---|---|
| 2025 | 2024 (R) | 2025 | 2024 (R) | 2025 | 2024 (R) | 2025 | 2024 (R) | 2025 | 2024 (R) | |
| Mining | 26 | 35 | 0 | 27 | 11,618.9 | 5,782.0 | 2,492.5 | 1,525.9 | 14,111.4 | 7,307.9 |
| Agriculture | 6 | 14 | 28 | 369 | 51.4 | 766.8 | 0.0 | 0.0 | 51.4 | 766.8 |
| Plantation & Commodities | - | 26 | - | 67 | - | 71.6 | - | 0.0 | - | 71.6 |
| Total | 32 | 75 | 28 | 463 | 11,670.3 | 6,620.5 | 2,492.5 | 1,525.9 | 14,162.8 | 8,146.3 |
| Primary Sector | Number of Project | Potential Employment | Domestic Investment (USD million)* | Foreign Investment (USD million)* | Total Investment (USD million)* |
|||||
|---|---|---|---|---|---|---|---|---|---|---|
| 2025 | 2024 (R) | 2025 | 2024 (R) | 2025 | 2024 (R) | 2025 | 2024 (R) | 2025 | 2024 (R) | |
| Mining | 26 | 35 | 0 | 27 | 2,861.8 | 1,296.4 | 613.9 | 342.1 | 3,475.7 | 1,638.5 |
| Agriculture | 6 | 14 | 28 | 369 | 12.7 | 171.9 | 0.0 | 0.0 | 12.7 | 171.9 |
| Plantation & Commodities | - | 26 | - | 67 | - | 16.0 | - | 0.0 | - | 16.0 |
| Total | 32 | 75 | 28 | 463 | 2,874.4 | 1,484.4 | 613.9 | 342.1 | 3,488.4 | 1,826.5 |
Note :
* – Due to rounding, figures presented in this table may not add up precisely to the totals provided
(R) – Revised Figures
2025 : US$1 = RM4.06
2024 : US$1 = RM4.46
Investment Performance
Gain Valuable Insight from Our Collection of Reports
Click here to download the latest statistical data
Explore the current business landscape in Malaysia
Malaysia’s dynamic and robust economy offers investors a multitude of opportunities within the manufacturing and services sectors.
Manufacturing
Main engine of Malaysia’s
economic growth with forward
and backward industrial linkages
and enabler of Industry 4.0
Services
Ever expanding sector with
an increasing focus on high
technology, providing
competitive advantages
for other industries

